Sustainability
- NAFCO Achieves ISO 14064-1 Greenhouse Gas Inventory Certification, Fulfilling Its ESG Commitment to Sustainable Carbon Reduction
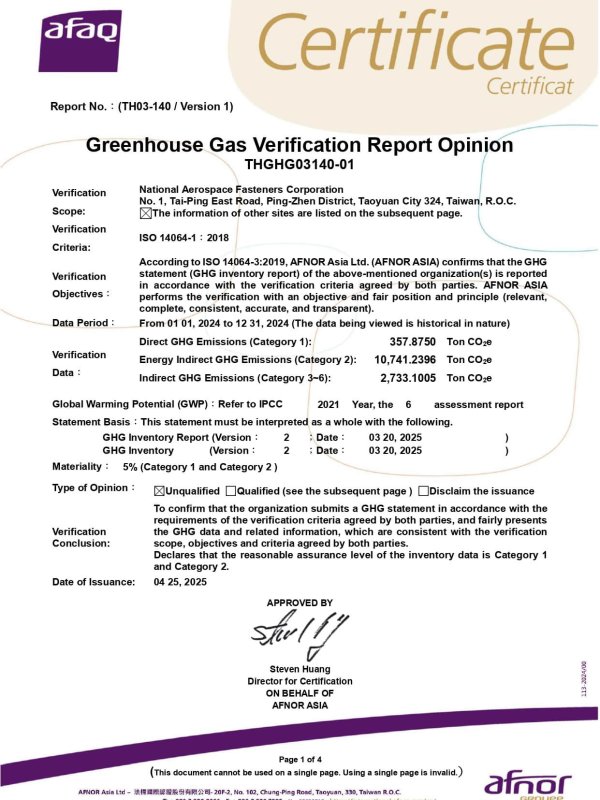
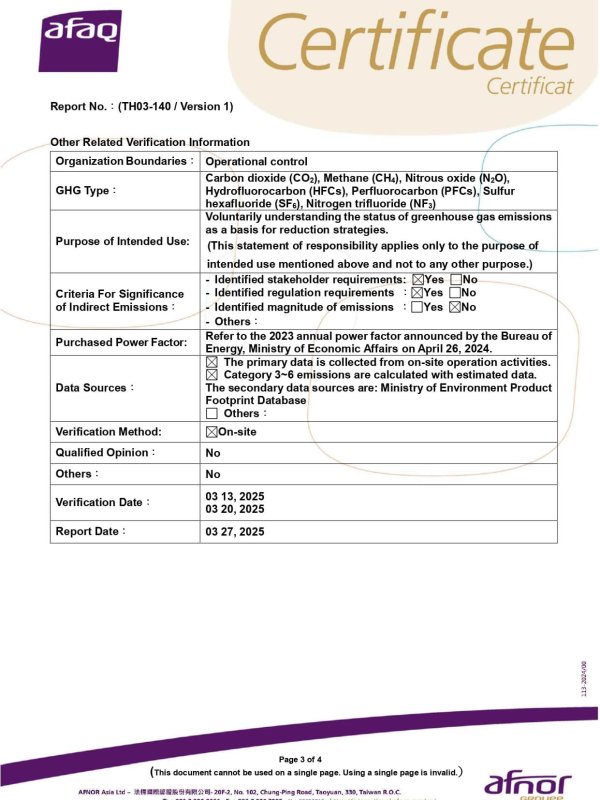
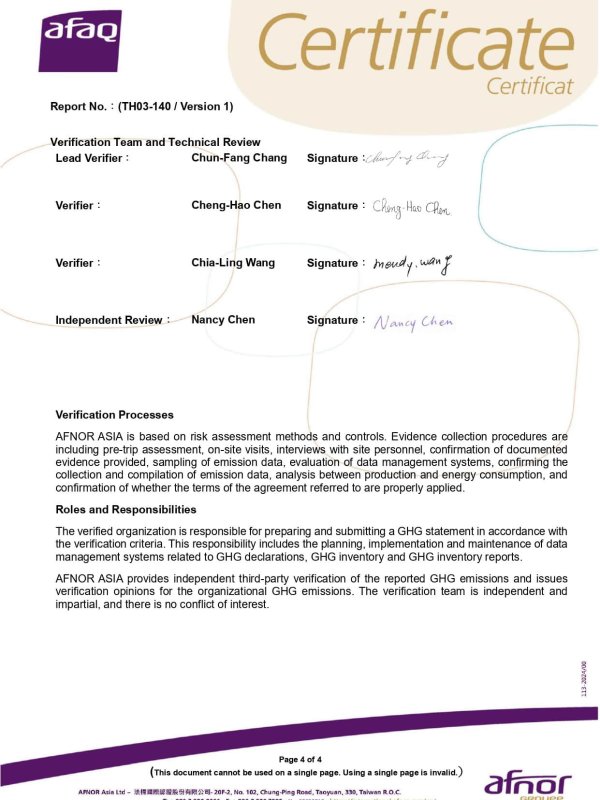
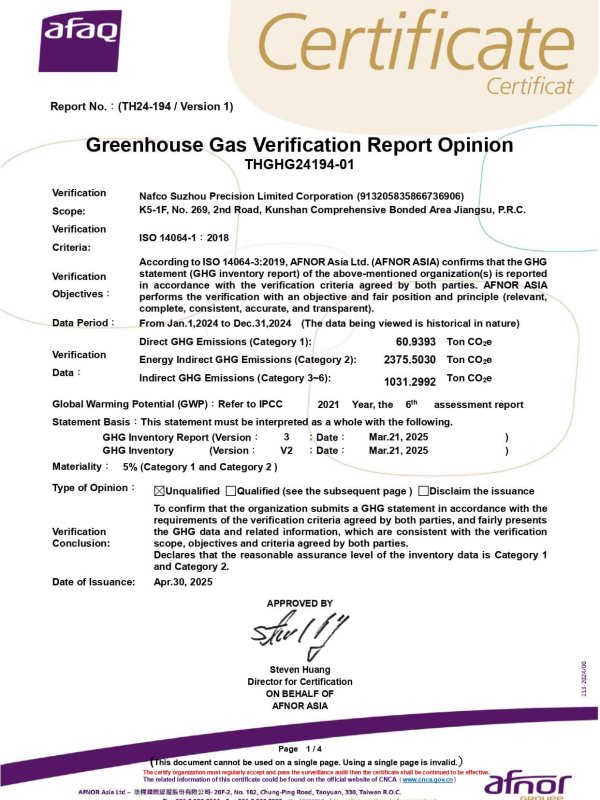
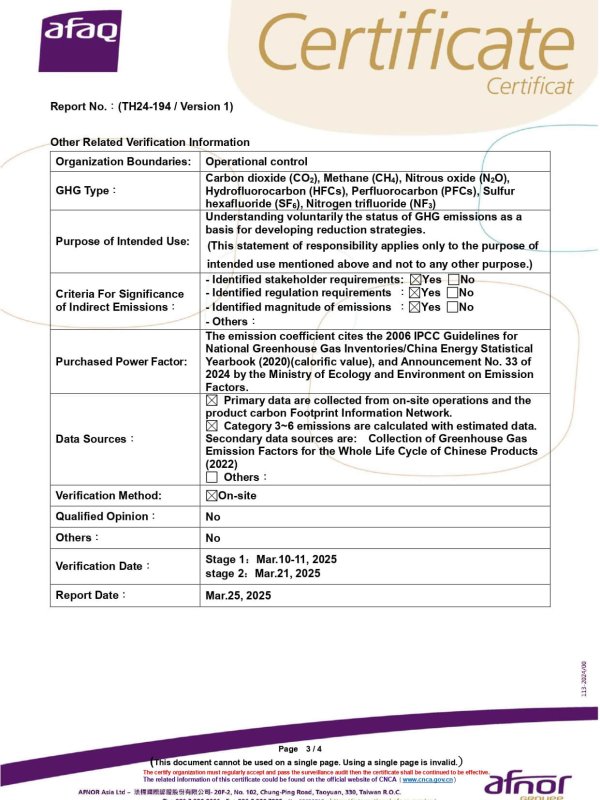
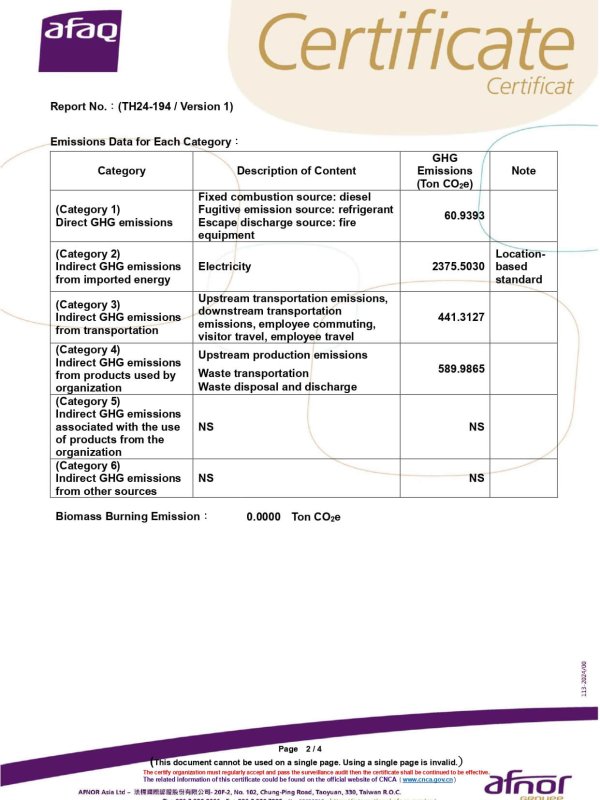
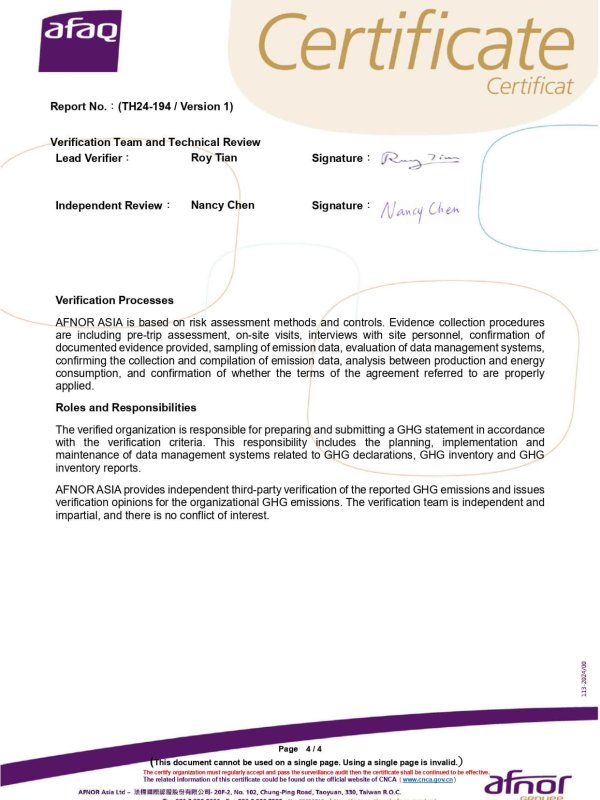
To actively promote sustainable development and carbon reduction goals, NAFCO successfully obtained ISO 14064-1:2018 Greenhouse Gas Inventory Certification from AFNOR ASIA in June 2024, with a 100% completion rate. This achievement marks a significant milestone in our journey toward sustainable operations and environmental protection.
Aligned with the carbon reduction pathway outlined in the Paris Agreement, NAFCO began conducting comprehensive greenhouse gas (GHG) inventories in 2022. We have implemented related carbon reduction initiatives, identifying both direct and indirect GHG emission sources within our operational boundaries. This ensures transparency in disclosing carbon data, meeting the expectations of our customers and other stakeholders, and fulfilling our corporate responsibility to mitigate global warming.
Greenhouse Gas Inventory Results Over the Past Three Years
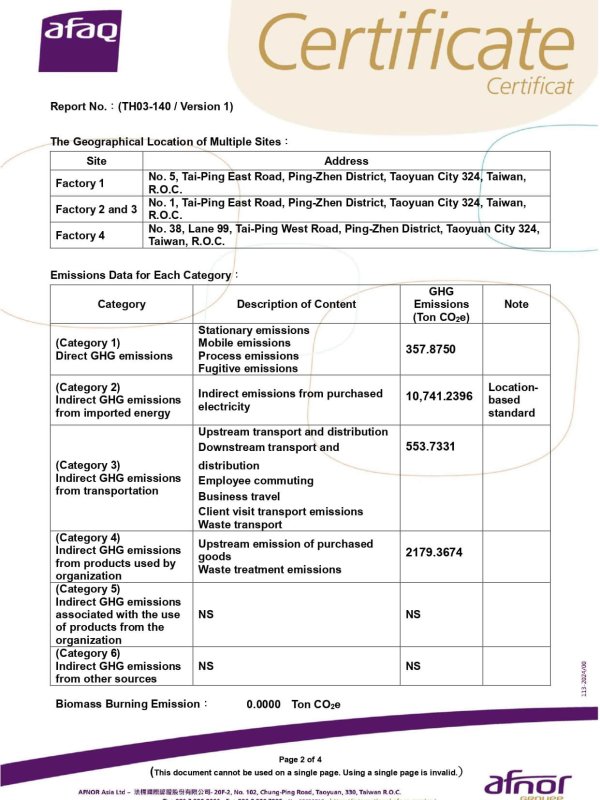
Following third-party verification conducted by AFNOR ASIA, NAFCO has compiled the following GHG emissions data for the years 2023 to 2024:
NAFCO Group | Scope 1 | Scope 2 | Scope 3 | Total |
2023 | 418.81 | 11733.12 | 9163.45 | 21315.76 |
2024 | 419.78 | 13116.74 | 3764.4 | 17299.96 |
Decarbonization Progress | 0.23% | 11.79% | -58.92% | -18.84% |
Greenhouse Emissions Reduction Target Initiative, Strategies, and Status
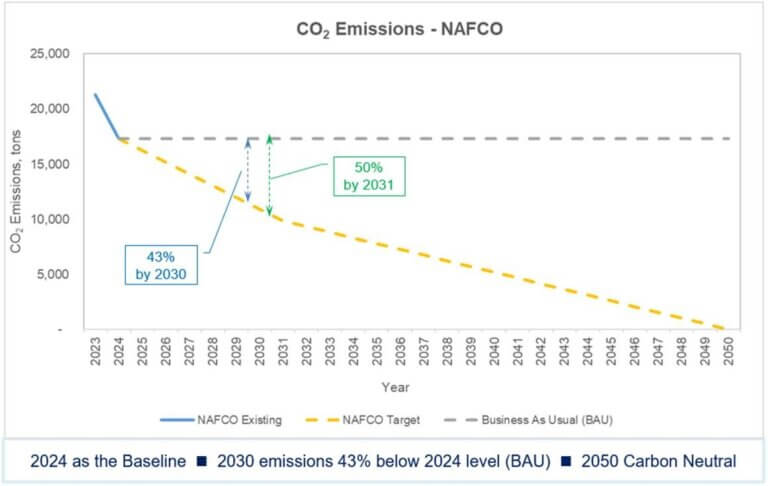
As the company continues to expand its production capacity, it has always been committed to pursuing EPS and ESG goals. In response to the Paris Agreement’s goal of reducing carbon emissions by 43% by 2035 and achieving net-zero carbon emissions by 2050, it also introduced TCFD in 2025: identifying the company’s short-, medium- and long-term climate risks and opportunities. In terms of the environment and climate change, it uses unit revenue greenhouse gas emissions as the main quantitative assessment key indicator, and at the same time refers to the SBTi process goals to set indicators such as electricity intensity, carbon emission intensity, waste intensity, water intensity, etc. to optimize various energy efficiencies. It also plans to continue to expand the proportion of green electricity to reduce environmental impact.
***Sustainable actions and goals for environmental issues include:
(1) Waste management: Continue to work hard to reduce waste output and implement waste classification, increase the proportion of recyclable business waste, and reduce waste treatment through waste reduction equipment. The goal is to reduce the annual business waste intensity (i.e. the weight of business waste per million revenue) by 3% year on year with 2021 as the base year.
(2) Carbon emission and energy management: Starting from 2022, we will conduct ISO14064-1 greenhouse gas inventory and disclosure, understand the environmental impact of operational energy consumption through the smart meter power monitoring platform, and reduce carbon emissions and electricity intensity through energy-saving strategies. The goal is to reduce the annual carbon emission intensity and electricity intensity (i.e., the number of units of electricity used per million in revenue) by 3% year on year, with 2024 as the base year.
(3) Water resource management: In addition to strengthening the promotion of water conservation, we will also introduce water-saving designs (such as induction faucets). Each plant has an independent professional sewage treatment plant. All treatment processes comply with environmental laws and regulations and will not affect the surrounding surface water bodies. A rainwater recycling system has also been built. The goal is to reduce the annual water intensity (i.e., the amount of water used per million in revenue) by 5% year on year, with 2024 as the base year.
(4) Starting from 2025, ESG-related environmental indicators will be linked to the KPI performance setting method of supervisors and managers of each unit to implement sustainable business goals.
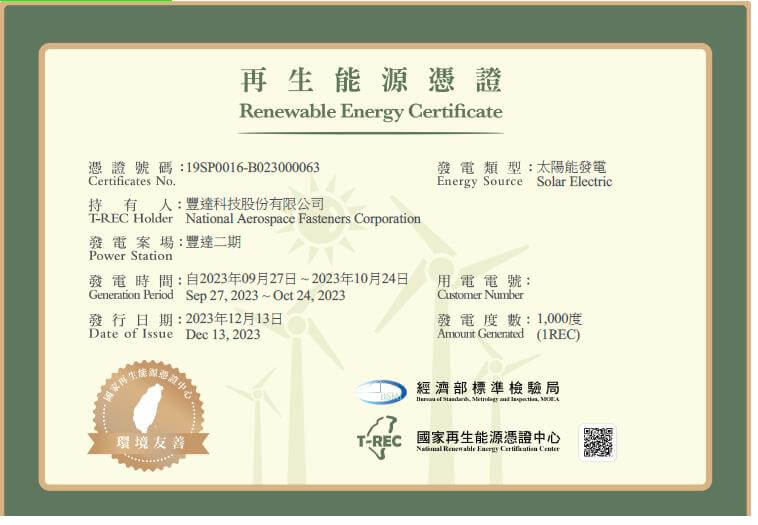
(5) Since 2019, the company has gradually invested in the construction of a solar power generation system (for self-use). In 2014, the company generated 199,045 kWh of solar power, and obtained 92 renewable energy certificates from the Ministry of Economic Affairs.
- Environment:
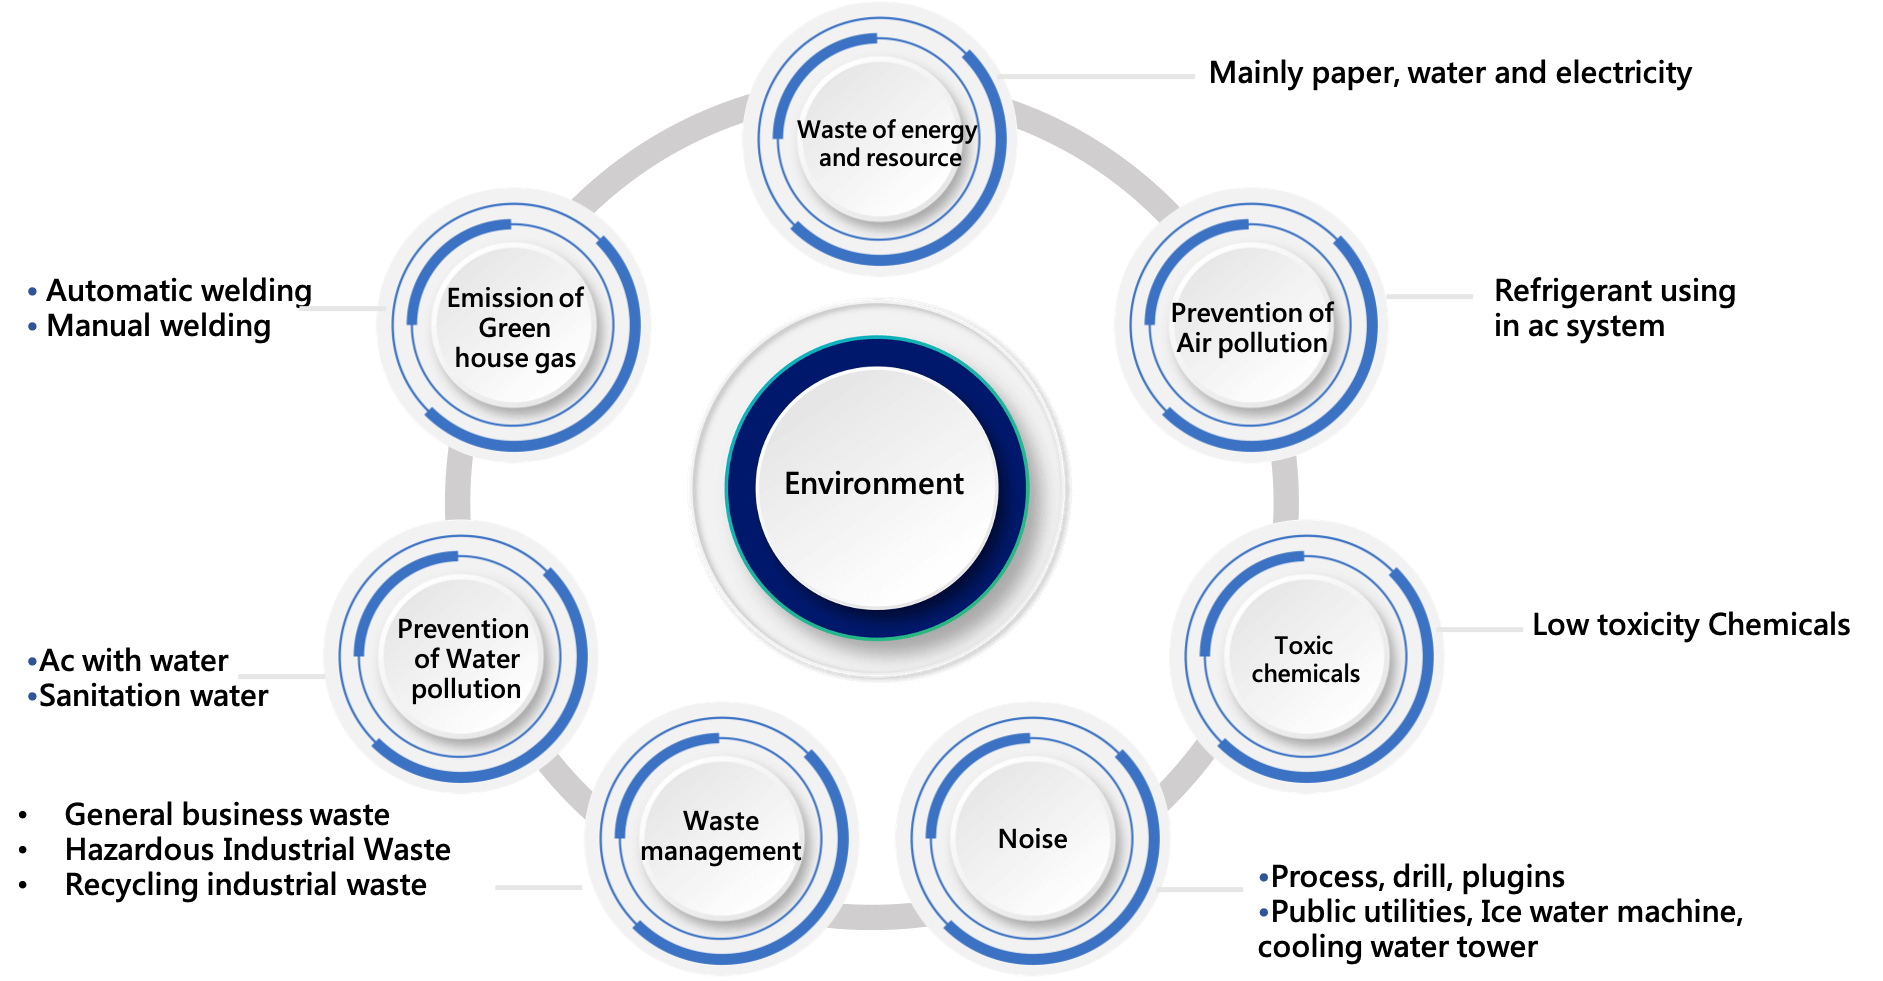
- Identify environmental considerations to prevent environmental pollution
- To implement environmental management by identifying the impact that the company’s existing and future activities, products and services may have on the environment through environmental considerations.
- Greenhouse Gas and Energy Management
- Practice energy conservation and carbon reduction to protect the planet.
NAFCO is mainly engaged in the design, assembly and maintenance of mechanical metalworking products, compared with other production, greenhouse gas emissions are smaller. However, in order to fulfill the responsibility of protecting the earth and respond to global climate change, we have set greenhouse gas inventory plans and reduction targets.
- Waste management
Reduce the amount at source and properly recycle and reuse
The sources of the company’s business waste are mainly R&D materials, waste products, packaging materials and employee household waste. We reduce the impact on the environment through strict sorting and management mechanisms, and entrust legal and responsible recyclers to dispose of hazardous industrial waste. The principle of waste disposal is mainly recycling, and the parts that cannot be recycled and reused will be destroyed by crushing and other methods, and recycled and reused. Basically, it will not be disposed of in landfills, and some waste will be disposed of by incineration, and in the future, the goal will be to reduce the proportion of incineration and reduce pollution year by year.
Waste statistics: In 2021, the weight of hazardous waste was 134.86 tons (35% of the total) and the weight of non-hazardous waste was 252.43 metric tons (65% of the total), with a total weight of 387.29 tons.
In 2022, the weight of hazardous waste was 127.32 tons (31%), and the weight of non-hazardous waste was 284.71 tons (69%), with a total weight of 412.03 tons.
In 2023, the weight of hazardous waste was 241.91 tons (45% of the total) and the weight of non-hazardous waste was 293.63 tons (55% of the total), for a total weight of 535.54 tons.
The waste output intensity in 2022 was reduced to 0.209 tons per million, equivalent to 0.298 tons in 2021, a decrease of 29.8%. The waste output intensity in 2023 was reduced to 0.196 tons per million, equivalent to 0.209 tons in 2022, and then continued to decline by 6.2%.
- Water Resource Management
- Implement water conservation and proper treatment
- Prevention of Air Pollution
- Environmental Protection
Upholding the belief that there is only one Earth, we actively improve our performance in climate change response, pollution prevention and control, energy and resource conservation, waste reduction, OHS management, and fire prevention to lower the overall environmental and OHS risk. We have also passed the certification for the ISO 14001:2015 Environmental Management System (EMS) to enforce environmental policy featuring respect and protection for Earth through the standardized routine management so as to fulfill our corporate social responsibility (CSR).
We began to actively engage in environmental protection and energy conservation, environmental education promotion, environmental protection and energy conservation culture building, and the implementation of measures related to environmental protection and energy conservation in 2019. Through continual process improvement and establishment and implementation of energy conservation policies, we aim to lower pollution, reduce energy consumption, and achieve eco-friendliness.
- Carbon Emission Reduction
To enhance the efficiency of resources, we invest in energy conservation activities such as using the photovoltaic system, LED energy-saving bulbs, green power and energy, and inverter devices; replace the IE3 motors; and implement aircon automatic control. We have also many renewable energy certificates (RECs) to maximize the efficiency of energy and resources to effectively reduce carbon emissions. In 2023, Nafco recycled 221,094 kWh of solar energy, and obtained 63 renewable energy certificates from the Ministry of Economic Affairs. The real-time power monitor and management platform had been built in 2023 for the purpose of effectively improving the use of electric energy.
To cherish Earth’s resources and reduce environmental impacts, apart from implementing paperless operations (operations are done electronically), we also encourage employees to make photocopies on both sides of the paper and use recycled bin liners.
- Water Conservation
To enforce environmental protection and value Earth’s resources, we have promoted the water conservation policy and taken related measures and invested in the wastewater treatment system and rainwater harvesting system to ensure water reclamation and reuse to practice CSR and protect Earth. In 2023, rainwater harvesting was 652MT.
- Energy and Environmental Management System
| Management System | Certification Unit | Period |
| ISO14001: 2015 EMS | Universal Certification Service Co., Ltd. | 2021/05~2024/05 |
- Data on Energy Consumption, Water Consumption, and Carbon Emissions

